
Data sonification is the technique of presenting data through non speech audio. Several research indicates positive effects of data sonification and its ability to convey information clearly. The target audience will focus on visually impaired people (VIP) and how data sonification can improve accessibility in different learning environments. Data sonification can also work as a support with other existing systems or technologies, such as haptic devices, to further immerse users in their ability to retain information.
The auditory system is capable of perceiving various layers of information within an environment solely through sounds. Qualities of sound—pitch, duration, intensity, and timbre—offer clarity in identifying sound sources, spoken words, and melodies. With sufficient training and exposure to these sounds, the human ears can be refined to detect meaningful information depending on their circumstances and expertise.
In 2019, Pew Research Center reported that 29% of the US respondents possess low scientific knowledge (Chafe). People with low science literacy may experience a harder time to make decisions on their health, finances, and other everyday decisions, especially decisions involving risk and probability. Research have indicated that auditory modality is a great tool to recognize patterns and connecting unfamiliar ideas, which can be important in knowledge retention and overcoming science literacy.
Carnegie Mellon University and MIT Media Lab developed an open-source sonification tool called Sonify to make data visualization, such as charts and graphs, accessible to VIP through audio and tactile interactions. The research team utilized a touch screen device for better orientation via scrubbing (dragging fingers from left and right). They also used keyboard audio navigation (keyboard shortcuts to play audio and reveal key summary information) for faster interactions between users and the application. Through Sonify, VIP were able to accurately understand information within stock market graphs (limitation of 2 lines) by varying pitch, timbre, and loudness to represent motion (Ali).
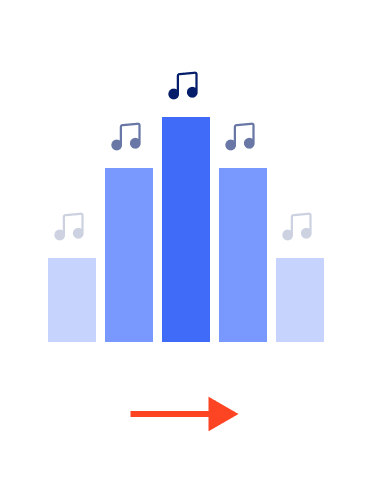
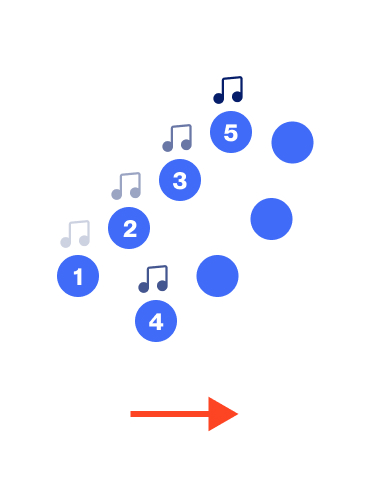
Another research incorporated 3D sound for audification (representing a sequence of data values as sound) and to aid spatial localization of sonified data. This 3D sound environment helps build better model of the behavior of a function and understanding its overall "shape". This research also incorporates multi-touch functionality to enhance interaction with data (Gillis and Nikitenkoa).
Demonstrates how different graphs are audified (Gillis and Nikitenkoa)

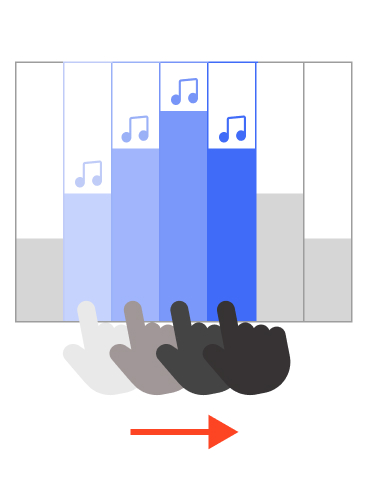
Different ways of interacting with the device when system is combined with both kinesthetic and audio modality (Gillis and Nikitenkoa)

Data sonification has this ability to enhanced learning and knowledge retention, especially for visually impaired people that may not have the same opportunity to engaged with visual data and photos. Many case studies combined auditory and other form of modalities to create more interactive environments. This suggest that further research may improve haptic devices and virtual reality environments through sonification techniques. Furthermore, data sonification is an intersecting field that relies on human-computer interaction studies and proper useability testing to truly create a n inclusive education space.
Ali, Safinah & Muralidharan, Laya & Alfieri, Felicia & Agrawal, Monali & Jorgensen, Jacob. (2020). Sonify: Making Visual Graphs Accessible. 10.1007/978-3-030-25629-6_70.
Chafe, Chris & Sawe, Nik & Trevino,Jeffrey. Using Data Sonification to Overcome Science
Literacy, Numeracy, and Visualization Barriers in Science Communication, Frontiers in Communication, vol. 5, 2020, 10.3389/fcomm.2020.00046
Denis Nikitenko, Daniel Gillis, Touching the Data: Exploring Data Sonification on Mobile Touchscreen
Devices, Procedia Computer Science, Volume 34, 2014, Pages 360-367, ISSN 1877-0509, https://doi.org/10.1016/j.procs.2014.07.038
